Icons are symbols that help users to interact with our devices, draw attention to features, and guide users through an interface, without relying on a written language.
Due to the growing occurrence of displays and the global reach of our products, universal icons are critical to a positive and consistent user experience. These basic principles help create the unique Envac icon library.
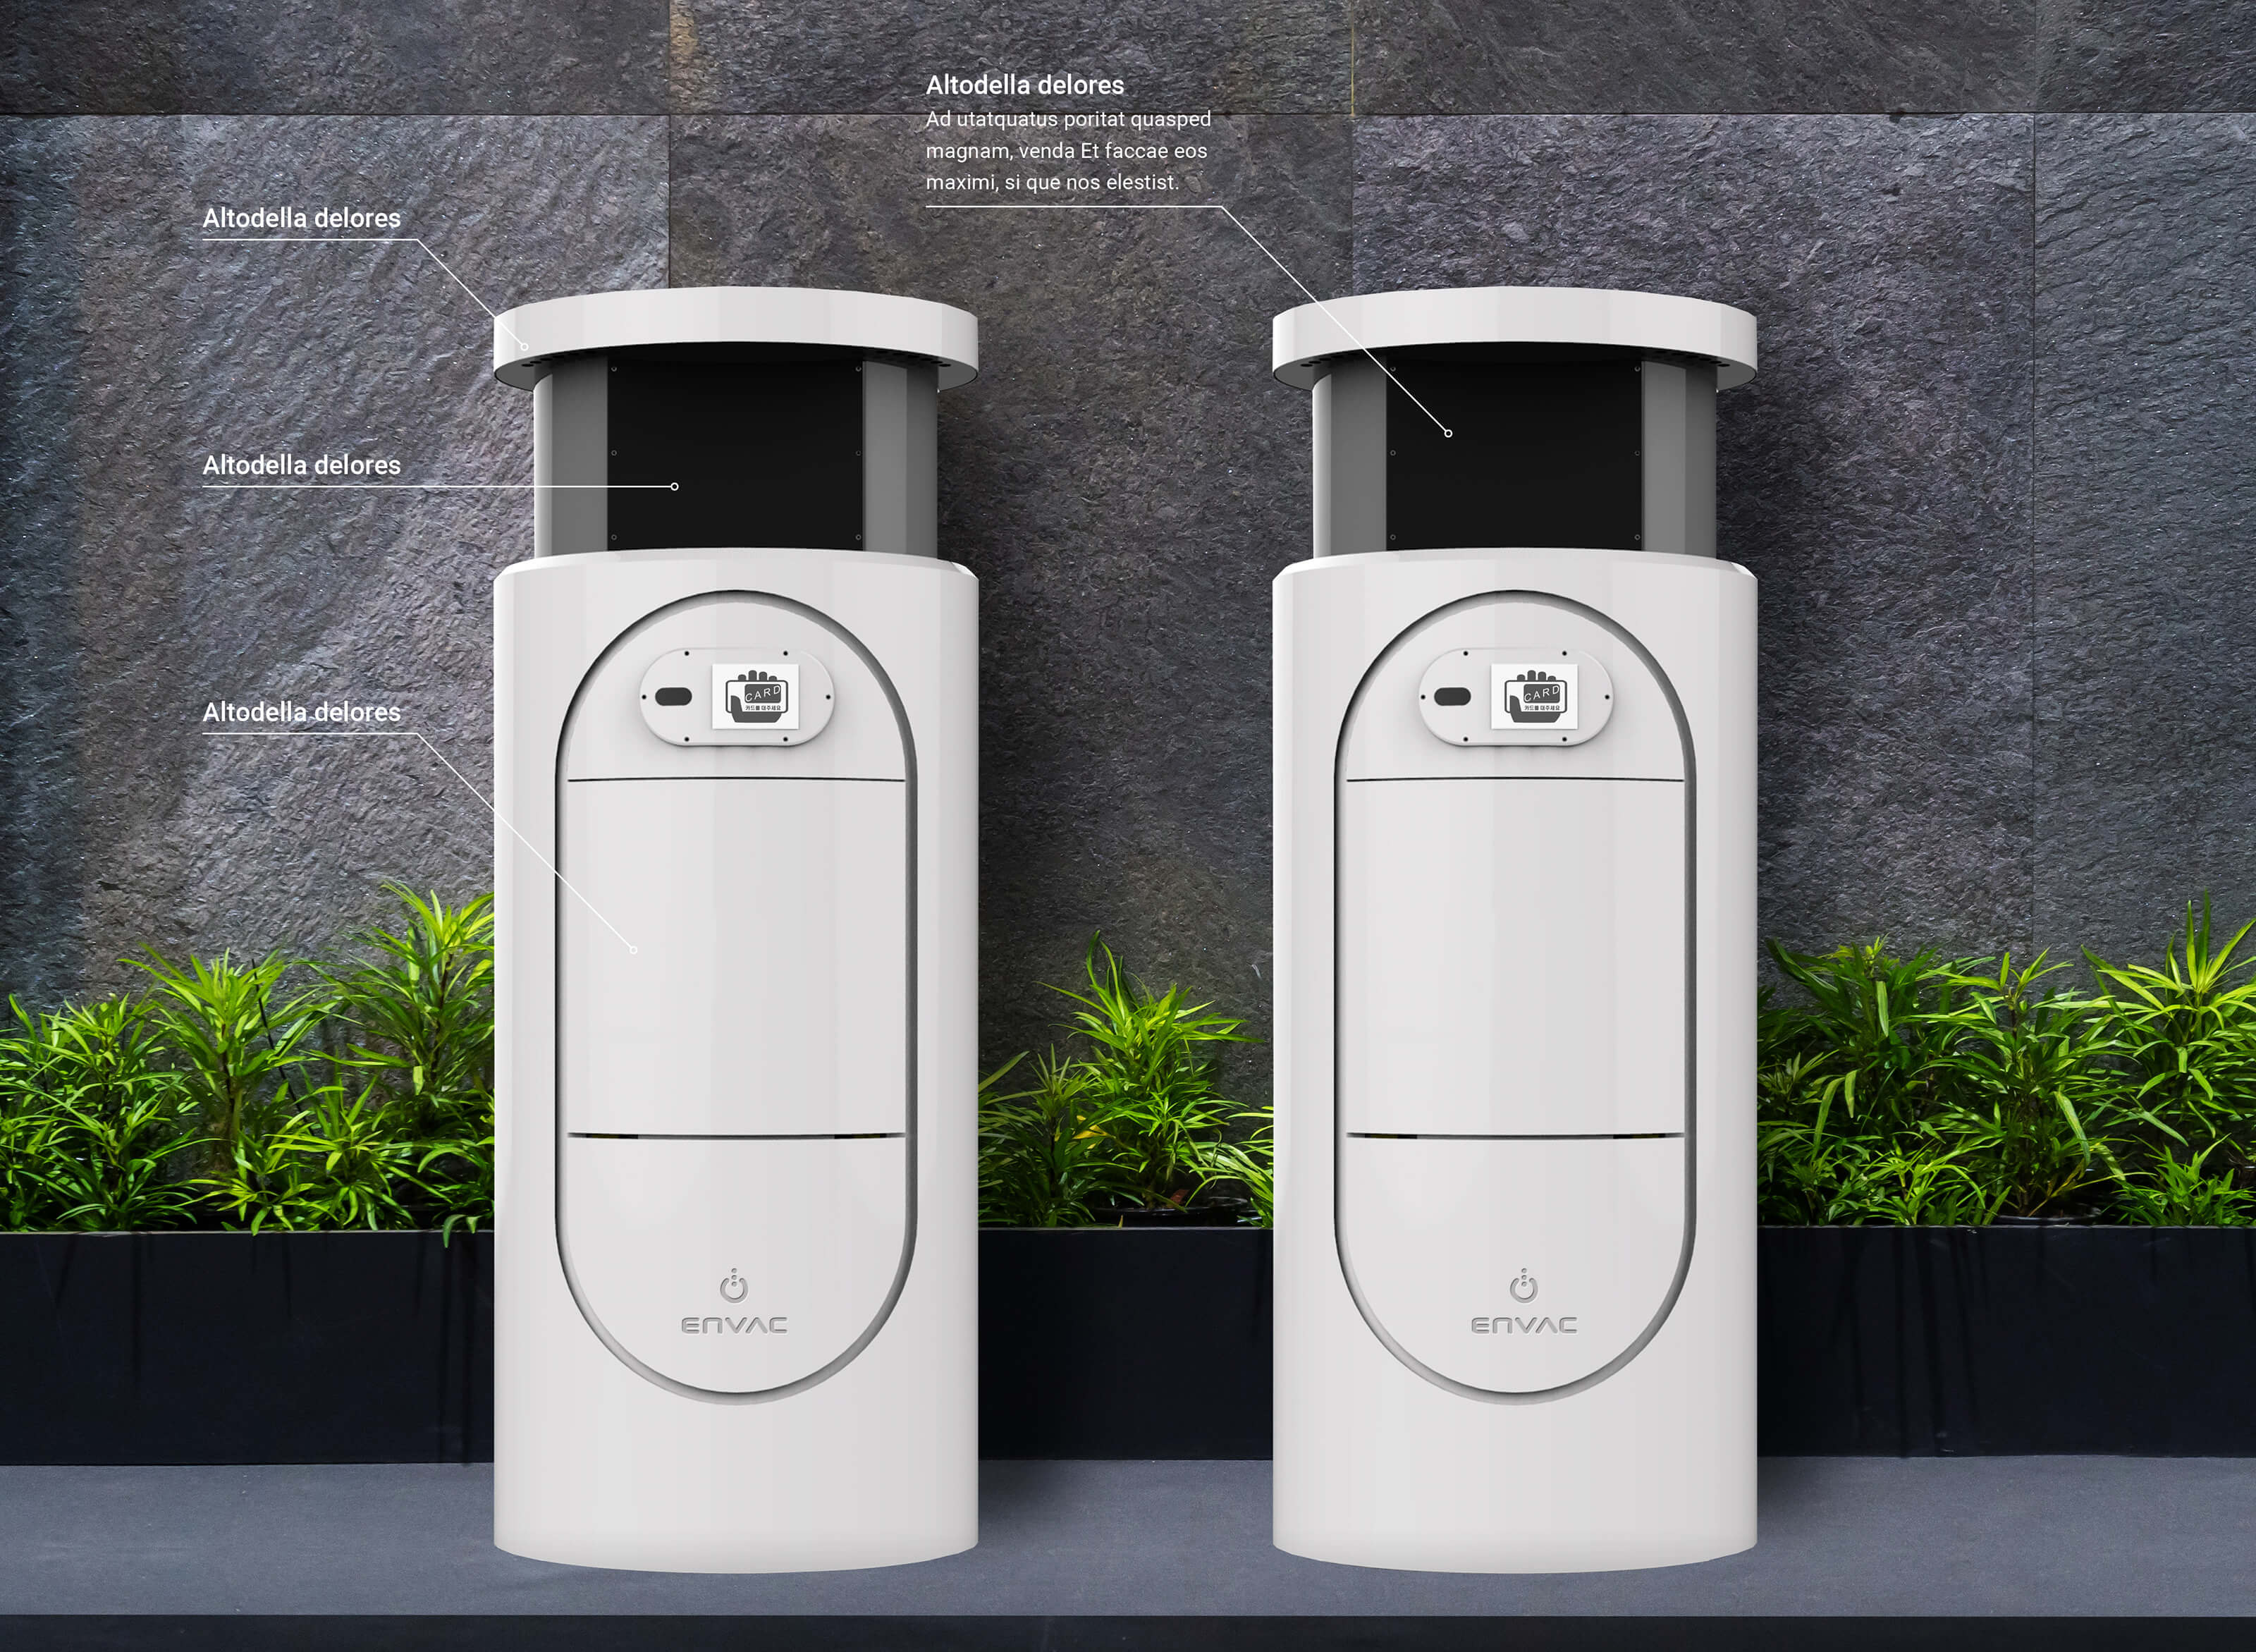
If there is not an imperative or established standard in a city/country/region we can always help the customer with icons for different types of waste. Note: These are only examples of colours, fractions and content per fraction. All of this can be adjusted to the customers specified needs.
Our polygon pattern is used to create a unique look and make our communications recognisable. The pattern can either be emphasized or played down individually to add visual interest and enhance our storytelling.
It adds depth, texture and visual interest when used on a photograph. Mainly, it is used to illustrate the connectivity of our system, that we are part of the smart, digitized city.
In the DAM system you will find both a still image called “polygon pattern” and our default video outro with the polygon pattern, the text “for future generations” and the logotype. Search “video outro”.
Section
Illustrations Lines
Section
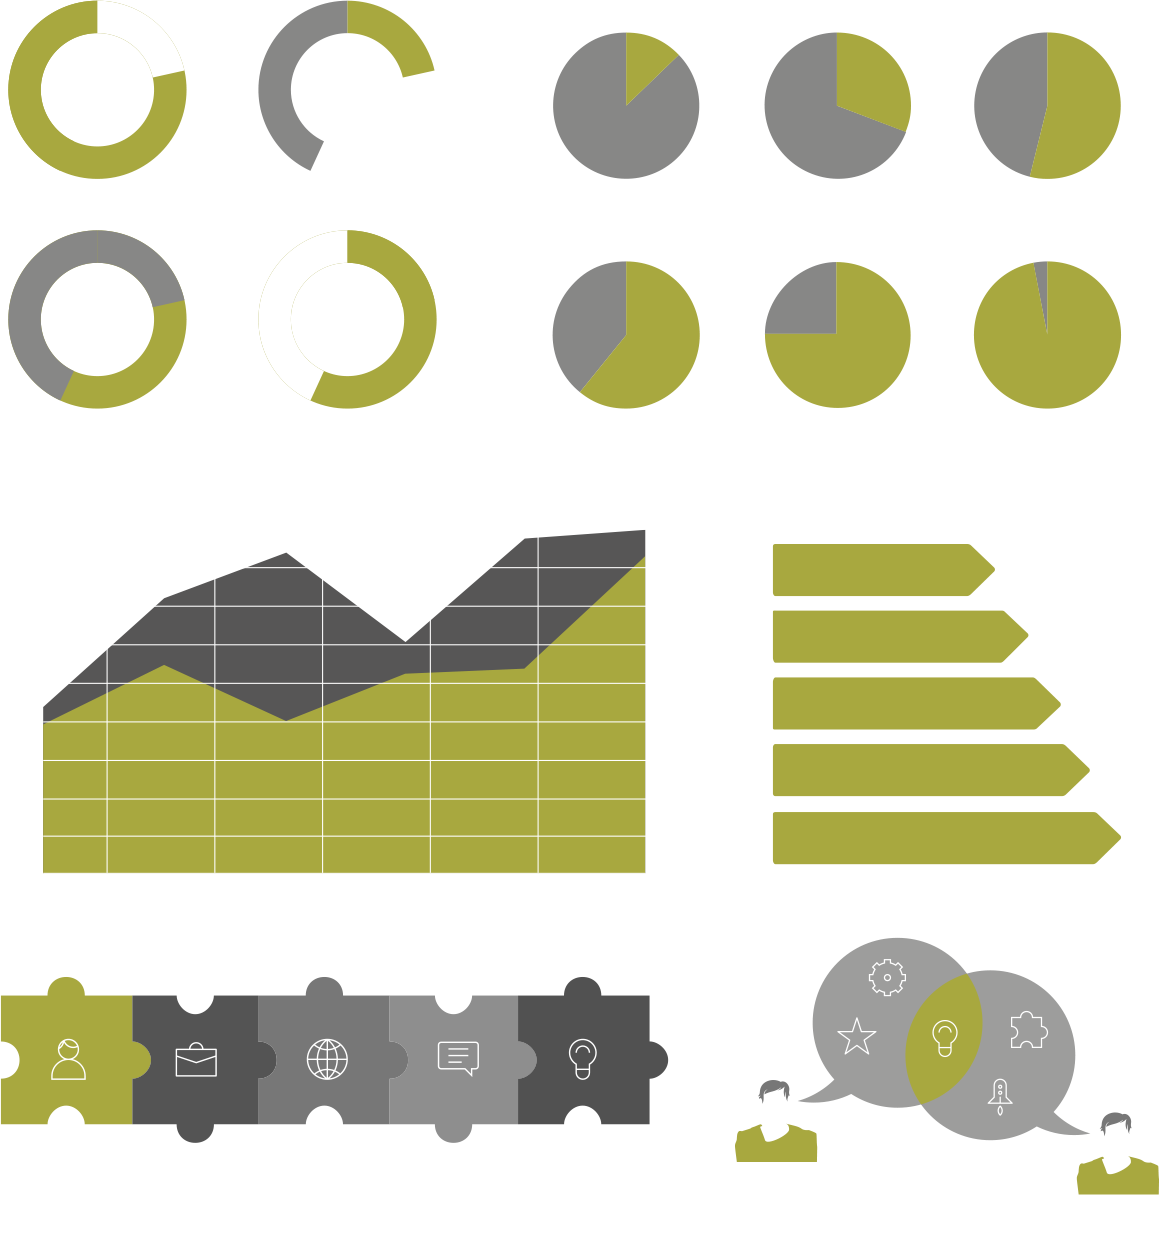
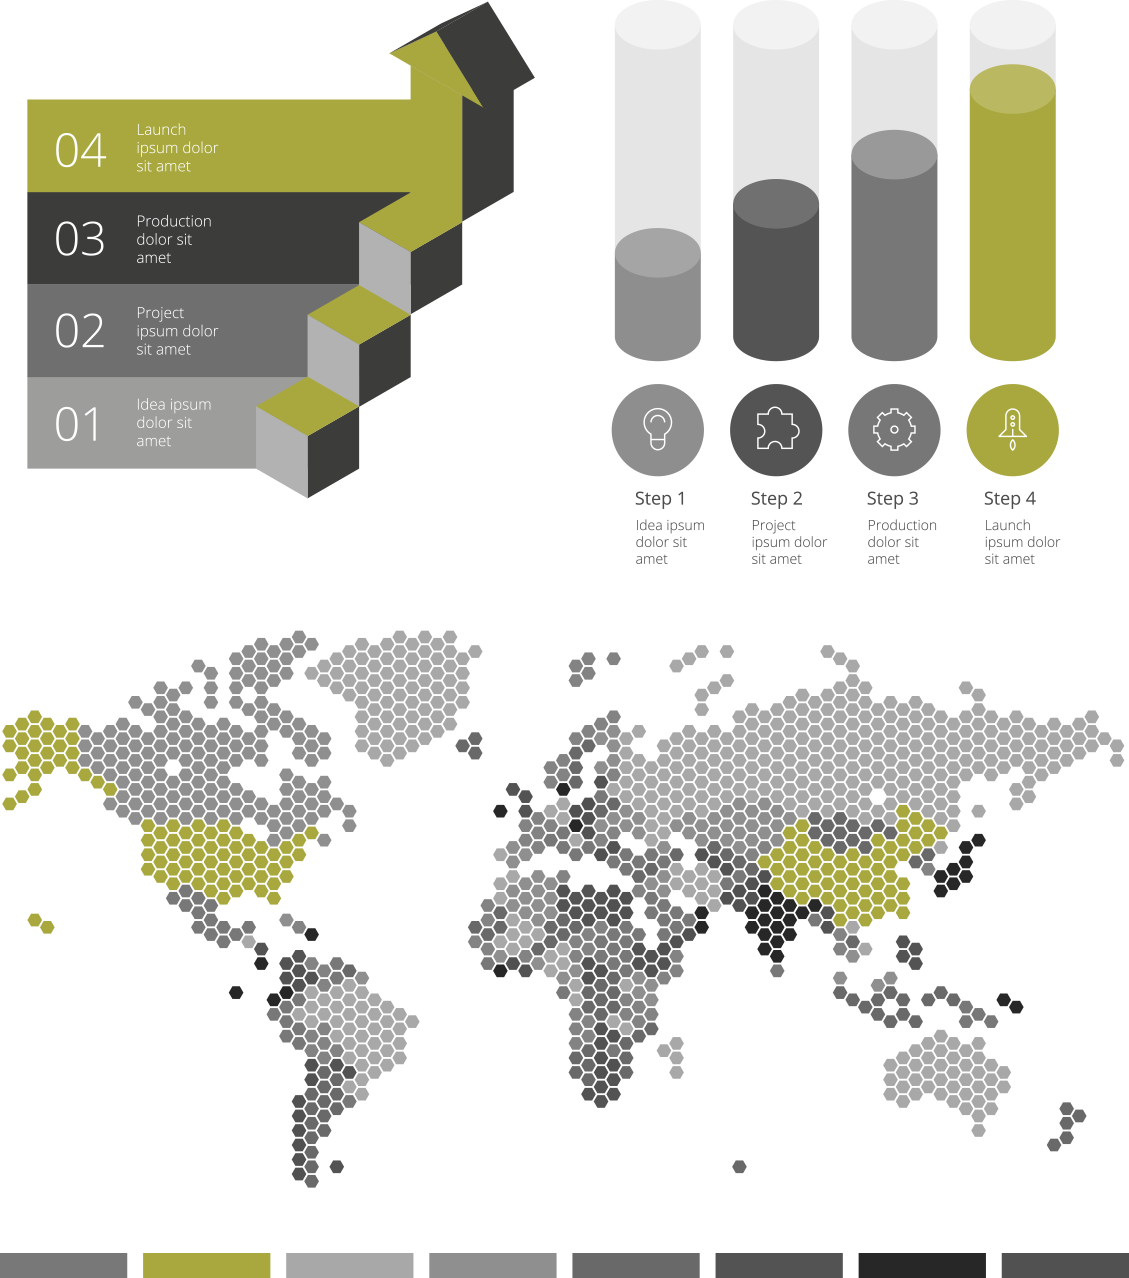
Infographics
Infographics are essential for ensuring that we are instantly recognisable, reliable and authentic. Always back up your claims or direction with our visualisations of statistics, arrows and figures, as well as charts and graphs.
PowerPoint and infographics
We have two sets of PowerPoint templates, on dark or light background, and with different sets of theme colours for use in graphics.
In Envac Dark/Light, the theme colours are the main brand colours: white, black, Envac Green and shades of grey – shown in this example.
In Envac Dark Secondary/Light Secondary you will find another, more colourful set of theme colours.
Examples of how to use our graphs. Please note the colour usage. If it is necessary to show Envac and four competitors in a graph or diagram, or five differentdevelopments over time, then you should illustrate this by using different colours.